
HKCERT Quals 2024 - Black-magic
by Gabriele Digregorio (Io_no), Roberto Alessandro Bertolini (MrIndeciso), and Riccardo Lamarca (Ric)

It seems university students often plays Black Magic. It should be the first time tuning (meaning: guessing, telepath, shamanism, mind-reading) for many people. Many language contains some black magic within. To those python expert: do you really know Python deep within? Time to tune what Python is thinking!
Overview
The zip file attached to the challenge contained the following files:
- A
docker-compose.ymlof an Alpine image with a specificPython 3.12.5version. The image was hardcoded with a specific hash, likely to ensure repeatable results. - A
srcfolder containing ana.pycfile and arun.shfile that simply executes thea.pycfile using Python. - A
README.mdfile explaining how to run the challenge. It also notes that the challenge behavior might differ on Python versions other than the one specified in the attached Docker.
pyc… what?
If you have some understanding of how the CPython implementation of the Python programming language works, you probably already know what a .pyc file is and can skip this section. For those unfamiliar, here is a brief explanation that will be helpful to understand the rest of the writeup.
To begin, let’s refer to the Python glossary:
Python is an interpreted language, as opposed to a compiled one, though the distinction can be blurry because of the presence of the bytecode compiler. […]
As mentioned, Python does indeed support some form of bytecode compilation. To clarify, it’s not the Python language itself that is inherently interpreted or compiled; these characteristics depend on the specific Python implementation. Python, as a language, specifies a set of fundamental elements, such as syntax. These specifications can be implemented in various ways. The most common implementation is CPython, which is so prevalent that it is often synonymous with Python itself.
According to Wikipedia,
CPython can be defined as both an interpreter and a compiler, as it compiles Python code into bytecode before interpreting it.
Again, CPython can indeed compile Python code into bytecode.
So, what exactly is a .pyc file? It is a file containing Python bytecode, which has been compiled from Python source code by CPython for optimization reasons.
TIP
Suggested Readings and Sources
The (Static) Basic Approach
When working with Python .pyc files, the initial step is often to decompile (or at least disassemble) the bytecode into something more comprehensible to humans. Here, we encounter the first challenge: Python bytecode is not designed for user manipulation, but rather for interpretation by the CPython interpreter itself. This makes Python bytecode highly volatile and subject to changes across different Python (CPython) versions. Consequently, a decompiler or disassembler that works for one specific version of CPython bytecode might not function with another version.
For this challenge, we used common tools designed for handling .pyc files. Specifically, we tried using pycdc, one of the most popular and up-to-date Python disassemblers and decompilers.
➜  build git:(master) ✗ ./pycdc a.pyc
# Source Generated with Decompyle++
# File: a.pyc (Python 3.12)

Unsupported opcode: GET_LEN (59)
# WARNING: Decompyle incomplete
➜  build git:(master) ✗
Unfortunately, the Python version used in the challenge was not fully supported by pycdc, and no decompiling was possible. However, disassembly was still an option. Although not ideal, disassembling is better than having no insight at all. We proceeded to disassemble the a.pyc file using pycdas and encountered a very strange outcome:
➜  build git:(master) ✗ ./pycdas a.pyc
a.pyc (Python 3.12)
[Code]
    File Name:
    Object Name:
    Qualified Name:
    Arg Count: 0
    Pos Only Arg Count: 0
    KW Only Arg Count: 0
    Stack Size: 0
    Flags: 0x00000000
    [Names]
    [Locals+Names]
    [Constants]
    [Disassembly]
        0       LOAD_LOCALS
        2       FORMAT_VALUE                    1 (FVC_STR)
        4       BUILD_TUPLE                     0
        6       GET_LEN
        8       SWAP                            2
        [...]
        10036   LOAD_DEREF                      7 <INVALID>
        10038   SWAP                            2
        10040   BUILD_STRING                    2
        10042   STORE_DEREF                     7 <INVALID>
        10044   LOAD_DEREF                      7 <INVALID>
        10046   CALL_INTRINSIC_1                1 (INTRINSIC_PRINT)
        10048   POP_TOP
        10050   RETURN_VALUE
pycdas reported no errors during disassembly, but the result looked strange: there were no names, constants, or locals, which is strange for a typical .pyc file, and most opcodes resulted invalid. We deduced that the bytecode was either hand-crafted or manipulated in such a way to break even disassembly.
Thus, since the static approach could result in a tedious process, we resorted to the old technique of “dynamic analysis”.
TL;DR
- The
CACHEopcode instruction in Python can lead to undefined behavior, if executed. This caused the challenge to work as expected only inside the provided Docker. - We used
libdebugto trace the execution of bytecode instructions. - The challenge built every string character-by-character using the
locals dictionary, including the flag. - Each character of the flag was compared with a corresponding character from the imput provided by the user. If the comparison failed, the CPython interpreter crashed due to illegal jumps within the bytecode.
- We successfully solved the challenge by attaching to the interpreter during execution, forcing each character comparison to succeed, and dumping the flag characters.
If you want to read a more detailed version of our solution and explore additional alternative solutions, keep reading.
The (Dynamic) Basic Approach
We attempted to run the a.pyc file to see if we could infer anything about the nature of the Python script. Unfortunately, the Python binary did not produce any output; it only requested an input. After receiving the input, it crashed. To be more precise, it was not the Python bytecode itself that crashed, but the CPython interpreter, which raised a segmentation fault. This is obviously not a common scenario, indicating that the bytecode must be executing some highly unusual and weird operations. This behavior was consistent across both the Docker environment and our native systems (Ubuntu Linux 22.04 with both Python 3.12.5 and 3.12.7, Arch Linux with Python 3.12.7, and Fedora Linux with Python 3.12.7).

We then proceeded to analyze the point of failure using GDB. We attempted debugging on our local systems using pwndbg, and also by attaching pwndbg to the Docker process running the Python interpreter. On all systems, the segmentation fault was due to illegal memory access during the dereferencing of a pointer; however, each system seemed to segfault at different points and during different operations.

Given the variations in Python versions and compilation processes on the different systems, and considering the challenge author’s advice about differing behaviors on versions other than the one in the Docker, we inferred with reasonable certainty that the segfault was somehow intended and related to the flag-checking process. The exact cause was still unclear at this stage.
The (Dynamic + Static) libdebug Approach
It became evident that we were dealing with a complex and unusual behaviour, making it crucial to precisely monitor and analyze the Python bytecode as it executed. To do so, we needed a reliable method to dump and track the runtime execution of the bytecode, specifically to observe exactly when and where the .pyc file was causing the Python interpreter to segfault.
Having worked on a similar problem in the past, we already had a libdebug script that does exactly that: it automatically sets some breakpoints in strategic locations inside the interpreter to dump the opcodes executed at runtime.
TIP
Suggested Readings and Sources
For our analysis, we slightly modified the code to better suit our debugging needs. Here’s a high-level overview of our strategy.
Setup
In order to facilitate a more in-depth analysis of the Python bytecode, we installed the development version of Python on our Arch system. This installation included all necessary symbols and ensured that the libpython library was dynamically linked rather than statically included within the Python binary. This configuration simplifies the process of setting breakpoints automatically and enhances the debugging capabilities. Alternatively, we could manually compile the CPython interpreter with specific flags to achieve a similar setup (e.g., --enable-shared).
NOTE
Compiling the CPython interpreter with the flag --with-pydebug will instead lead to an assertion error due to the way the challenge was built. The assertion error is the following one.
python3.12: Python/generated_cases.c.h:1632:_PyEval_EvalFrameDefault:Assertion `STACK_LEVEL() <= STACK_SIZE()' failed.
[1]    79438 IOT instruction (core dumped)  python3.12 a.pyc
TIP
Suggested Readings and Sources
Automatic Breakpoint Dump
Conceptually, the execution of Python bytecode involves a classic main loop. This loop processes each bytecode instruction one at a time, identifying the type of instruction based on its opcode through an if-else or match-case structure, parses the instruction arguments, and then executes the corresponding operation.
However, due to performance and optimization reasons, the actual implementation in CPython is more complex. Within the CPython source code, notably in generated_cases.c.h, the dispatching mechanism isn’t confined to a single code point but is defined using macros. This distinction is crucial for our purposes.
// Code from python/cpython/Python/generated_cases.c.h

// Omitted code

TARGET(BINARY_OP) {
    // Omitted code
    stack_pointer[-1] = res;
    next_instr += 1;
    DISPATCH();
}

TARGET(SWAP) {
    // Omitted code
    stack_pointer[-1] = bottom;
    stack_pointer[-(2 + (oparg-2))] = top;
    DISPATCH();
}
TARGET(GET_LEN) {
    // Omitted code
    STACK_GROW(1);
    stack_pointer[-1] = len_o;
    DISPATCH();
}

TARGET(MATCH_CLASS) {
    // Omitted code
    STACK_SHRINK(2);
    stack_pointer[-1] = attrs;
    DISPATCH();
}

// Omitted code
As illustrated, after each instruction is executed, the DISPATCHER() is executed as well. However, this isn’t a function call but a macro expansion, defined as:
// Code from python/cpython/Modules/_sre/sre_lib.h

#if USE_COMPUTED_GOTOS
    #define TARGET(OP) TARGET_ ## OP
    #define DISPATCH                       \
        do {                               \
            MAYBE_CHECK_SIGNALS;           \
            goto *sre_targets[*pattern++]; \
        } while (0)
#else
    #define TARGET(OP) case OP
    #define DISPATCH goto dispatch
#endif
Without going into further details, it could potentially expand into a jump to a computed address due to computed_goto, similar to a jump table mechanism.
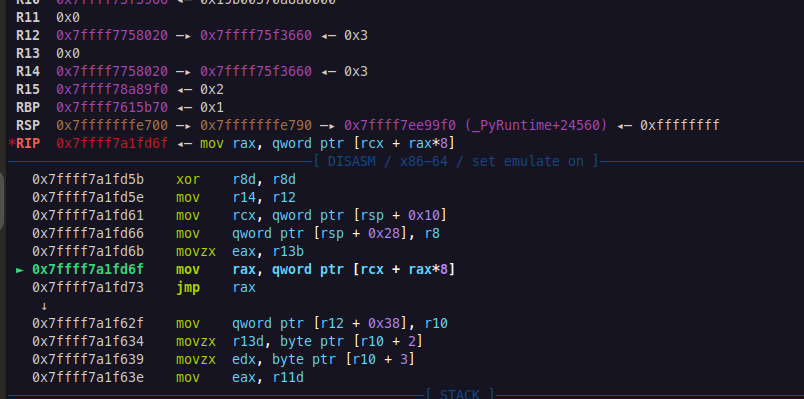
Here is a representative snippet of assembly code that might be generated from the macro expansion:
 ...
 mov    r15, rax
 mov    r14, qword ptr [rbp - 0x128]
 mov    rax, qword ptr [rbx + rax*8]
 jmp    rax
In this assembly code, rax initially contains the opcode and subsequently the address to which the jump will occur, while r15 stores the opcode value for use after the jump. This mechanism is critical for executing the logic corresponding to the parsed opcode. Note that this description is specific to Python 3.12.7 on Arch Linux; different Python compilations may use different registers or slightly varied assembly operations.
Given this complexity, our approach involved searching the libpython shared library for all occurrences of the macro expansion. We used elftools to open the libpython library and defined specific signatures with capstone to match the described macro expansions.
The following code snippet outlines our method:
from capstone import CS_ARCH_X86, CS_MODE_64, Cs
from elftools.elf.elffile import ELFFile

# Find the offsets of the DISPATCHER macro expansion in the libpython shared library
def find_patterns_in_section(section, md):
    """Find patterns in the given section. We want to find every DISPATCHER inlined in the libpython shared library."""
    jmp_rax_offsets = []
    prev_instructions = []

    for i in md.disasm(section.data(), section["sh_addr"]):
        prev_instructions.append((i.mnemonic, i.op_str))
        if len(prev_instructions) > 2:
            prev_instructions.pop(0)

        if len(prev_instructions) == 2:
            if (
                prev_instructions[0] == ("mov", "rax, qword ptr [rdi + rax*8]")
                or prev_instructions[0] == ("mov", "rax, qword ptr [rbx + rax*8]")
                or prev_instructions[0] == ("mov", "rax, qword ptr [rdx + rax*8]")
                or prev_instructions[0] == ("mov", "rax, qword ptr [rcx + rax*8]")
                or prev_instructions[0] == ("mov", "rax, qword ptr [r8 + rax*8]")
                or prev_instructions[0] == ("mov", "rax, qword ptr [r9 + rax*8]")
                or prev_instructions[0] == ("mov", "rax, qword ptr [rsi + rax*8]")
            ) and prev_instructions[1] == ("jmp", "rax"):
                jmp_rax_offsets.append(i.address)
            elif (
                prev_instructions[0] == ("mov", "rax, qword ptr [rdi + rax*8]")
                or prev_instructions[0] == ("mov", "rax, qword ptr [rbx + rax*8]")
                or prev_instructions[0] == ("mov", "rax, qword ptr [rdx + rax*8]")
                or prev_instructions[0] == ("mov", "rax, qword ptr [rcx + rax*8]")
                or prev_instructions[0] == ("mov", "rax, qword ptr [r8 + rax*8]")
                or prev_instructions[0] == ("mov", "rax, qword ptr [r9 + rax*8]")
                or prev_instructions[0] == ("mov", "rax, qword ptr [rsi + rax*8]")
            ) and prev_instructions[1] == ("jmp", "rax"):
                jmp_rax_offsets.append(i.address)

    return jmp_rax_offsets

# Open the libpython shared library and find the offsets of interest
with open("/usr/lib/libpython3.12.so.1.0", "rb") as f:
    elf = ELFFile(f)
    md = Cs(CS_ARCH_X86, CS_MODE_64)

    # Collect all offsets from executable sections
    all_offsets = []
    for section in elf.iter_sections():
        if section["sh_flags"] & 0x4:  # SHF_EXECINSTR
            offsets = find_patterns_in_section(section, md)
            all_offsets.extend(offsets)
TIP
Suggested Readings and Sources
Tracing with libdebug Callbacks
Having identified all the code points where the macro expansion can be executed, we proceeded to use libdebug to programmatically debug the Python interpreter and trace the bytecode. Our approach involved setting a breakpoint at each identified location and installing a callback to each of these breakpoints. In libdebug, a callback is a Python function triggered every time a specific event is hit and that can interact with the process.
For our purposes, the callback function was designed to read the value of r15—which held the opcode value—and then map this opcode to its corresponding mnemonic instruction name. The mnemonic names for the opcodes were extracted from the opcode_ids.h file located in the python/cpython/Include/ directory of the CPython source code. We decided not to use the opcode and dis modules provided by Python, as they seemed incomplete and lacked definitions for some opcodes we encountered during our analysis. Specifically, in Python 3.12.5, the so-called specialized opcodes were not associated with their numerical values in the opcode module. Due to the low-level tracing we were using, we encountered various specialized opcodes during this process requiring a more complete opcode mapping. This limitation also affects the dis module, which internally relies on opcode, thus it cannot address this gap. It was only with Python 3.13 that a private attribute, opcode._specialized_opmap, was introduced in the opcode module, which includes these specialized opcodes.
from libdebug import debugger

def dumper(t, _):
    """Callback function to dump the executed python opcode."""
    print(
        f"Executed opcode: {t.regs.r15:#x} - {opcode_to_mnemonic.get(t.regs.r15, 'UNKNOWN')}"
    )

d = debugger(["python3.12", "./src/a.pyc"])

r = d.run()

for addr in all_offsets:
    d.breakpoint(addr, file="libpython3", callback=dumper)

# Start the execution
d.cont()

# Send the flag attempt
r.sendline(b"hkcert24{provola}")

# Wait for the process to terminate
d.wait()

# Crosscheck the segfault
print(d.exit_signal)
TIP
Suggested Readings and Sources
Isolating the Challenge’s Opcodes
Another challenge we faced was that the Python interpreter adds additional instructions before and after those associated with the Python code we aimed to execute. Our goal was to isolate only the instructions contained within the.pyc file.
To achieve this, we delved back into the CPython source code, specifically targeting the run_pyc_file function within the python/cpython/Python/pythonrun.c file. This function takes a file descriptor as input and initiates the execution of the bytecode by calling run_eval_code_obj, which handles the extracted Python structures and eventually executes the bytecode. Therefore, any opcode executed before this function is called cannot be associated with the .pyc file provided in the challenge. Moreover, since the interpreter experienced a segmentation fault during the execution of the .pyc bytecode, we could also confirm that the last instruction dumped by our script was indeed part of the .pyc file.
Below is the updated script to isolate the .pyc executed opcodes:
d = debugger(["python3.12", "./src/a.pyc"])

r = d.run()

# We want to dump only the executed python opcodes from the .pyc file
# Let put a breakpoint on the run_pyc_file function as a guard
run_pyc_file = d.breakpoint(0xCB761, file="libpython3", hardware=True)

# Start the execution
d.cont()

# Send the flag attempt
r.sendline(b"hkcert24{provola}")

if run_pyc_file.hit_on(d):
    # The python .pyc script has started, we can now set the breakpoints to dump the executed opcodes
    for addr in all_offsets:
        d.breakpoint(addr, file="libpython3", callback=dumper)
    # We can now disable the guard breakpoint
    run_pyc_file.disable()

# Continue
d.cont()

# Wait for the process to terminate
d.wait()

# Crosscheck the segfault
print(d.exit_signal)
Cutting Even More Instructions
Analyzing the bytecode already proved to be quite challenging due to its complexity. To make this task more manageable, we divided the bytecode into smaller parts. Our primary goal was to isolate the portion of the bytecode that manipulated the input we provided. Our approach to achieve this was straightforward: we executed the dumper again without providing any input—by commenting out the line r.sendline(b"hkcert24{provola}"). This allowed the .pyc execution to stall while waiting for input, ensuring that the dumped instructions up to that point did not involve any input manipulation. Any instructions following this would potentially manipulate the input.
To further refine our analysis, we focused also on ignoring internal bytecode operations that handle the reading from stdin, processing the results, and building the Python string (or bytestring) object in memory. Our method involved continuously searching the memory for the input string before the execution of each bytecode instruction. To do so, we used the libdebug method d.memory.find() to search through memory. To enhance the efficiency of this operation, we activated the fast_memory flag within our debugger initialization. This was accomplished by configuring our debugger instance as follows: d = debugger(["python3.12", "./src/a.pyc"], fast_memory=True).
Additionally, we shifted from libdebug asynchronous breakpoints to synchronous breakpoints. This change involved removing the callbacks during breakpoint installation. While with asynchronous breakpoints, each time the breakpoint is hit the callback is executed internally in libdebug and, at the end, the process continues, with synchronous breakpoints, after being hit, the debugger will not continue the process automatically, executing our commands from the main script instead. By employing synchronous breakpoints, we were able to directly control the execution flow and more effectively understand the exact bytecode operations interacting with the input.
This strategy allowed us to eliminate all bytecode operations performed before the entire input string was found in memory. Surprisingly, this approach helped us discard most of the bytecode instructions, as very few were executed after the complete string was built and located in memory.
Due to the small number of instructions remaining, we decided to pass to manual analysis using an interactive debugger, like GDB. We manually traced the CPython code executed from the point where the full input string was found in memory up to the occurrence of the segmentation fault. To facilitate this transition seamlessly, we took advantage of a helpful feature in libdebug that allows us to detach the process from libdebug and reattach it to GDB, continuing the debugging session in GDB while preserving the breakpoints.
The resulting script is as follows:
d = debugger(["python3.12", "./src/a.pyc"], fast_memory=True)

r = d.run()

# We want to dump only the executed python opcodes from the .pyc file
# Let put a breakpoint on the run_pyc_file function as a guard
run_pyc_file = d.breakpoint(0xCB761, file="libpython3", hardware=True)

# Start the execution
d.cont()

# Send the flag attempt
# (if we don't send the flag, the .pyc will hang and we can undestand the point in the pyc where the input is asked)
r.sendline(b"hkcert24{provola}")

if run_pyc_file.hit_on(d):
    # The python .pyc script has started, we can now set the breakpoints to dump the executed opcodes
    for addr in all_offsets:
        d.breakpoint(addr, file="libpython3")  # sync breakpoints
    # We can now disable the guard breakpoint
    run_pyc_file.disable()

# Continue
d.cont()

counter = 0
while any(bp.hit_on(d) for bp in d.breakpoints.values()):
    # print(f"Executed opcode: {d.regs.r15:#x} - {opcode_to_mnemonic.get(d.regs.r15, 'UNKNOWN')}")
    counter += 1
    # We identified 223 as the point where the input is asked
    # Now we want to pass to GDB when the input is found in memory
    if counter > 223 and (found := d.memory.find("hkcert24{provola}")):
        print(f"Found input in memory at {[hex(findus) for findus in found]}")
        break
    d.cont()
    d.wait()

d.gdb()
TIP
Suggested Readings and Sources
Searching for the Segfault Origin
With only a few Python instructions left to analyze, we aimed to understand the role of our input in triggering the segfault in the CPython interpreter. After meticulous step-by-step tracing in GDB, using si and ni, we traced the operations performed on the input leading to a… boring Python internal decode operation.

Initially, it seemed we had reached a dead end. However, there was still hope. The very last executed Python instruction before crash was a CACHE instruction.
Let’s analyze the execution flow of the CACHE instruction by examining the CPython source code. In generated_cases.c.h, the CACHE case is defined as follows:
// Code from python/cpython/Python/generated_cases.c.h

TARGET(CACHE) {
    #line 3482 "Python/bytecodes.c"
    assert(0 && "Executing a cache.");
    Py_UNREACHABLE();
    #line 4801 "Python/generated_cases.c.h"
}
The Py_UNREACHABLE() macro is instead defined in pymacro.h as follow:
// Code from python/cpython/Include/pymacro.h

#if defined(RANDALL_WAS_HERE)
#  define Py_UNREACHABLE() \
    Py_FatalError( \
        "If you're seeing this, the code is in what I thought was\n" \
        "an unreachable state.\n\n" \
        "I could give you advice for what to do, but honestly, why\n" \
        "should you trust me?  I clearly screwed this up.  I'm writing\n" \
        "a message that should never appear, yet I know it will\n" \
        "probably appear someday.\n\n" \
        "On a deep level, I know I'm not up to this task.\n" \
        "I'm so sorry.\n" \
        "https://xkcd.com/2200")
#elif defined(Py_DEBUG)
#  define Py_UNREACHABLE() \
    Py_FatalError( \
        "We've reached an unreachable state. Anything is possible.\n" \
        "The limits were in our heads all along. Follow your dreams.\n" \
        "https://xkcd.com/2200")
#elif defined(__GNUC__) && (__GNUC__ > 4 || (__GNUC__ == 4 && __GNUC_MINOR__ >= 5))
#  define Py_UNREACHABLE() __builtin_unreachable()
#elif defined(__clang__) || defined(__INTEL_COMPILER)
#  define Py_UNREACHABLE() __builtin_unreachable()
#elif defined(_MSC_VER)
#  define Py_UNREACHABLE() __assume(0)
#else
#  define Py_UNREACHABLE() \
    Py_FatalError("Unreachable C code path reached")
#endif
As you can see, in most of the interesting cases, Py_UNREACHABLE() is expanded as __builtin_unreachable(). __builtin_unreachable() is a compiler directive that marks certain code paths as never intended to be executed, informing the compiler that control should not reach this part of the code. This directive leads to various optimizations, such as the reorganization, removal, or merging of code blocks under the assumption that these paths are indeed unreachable. One of the more interesting implications is that if execution does unexpectedly reach __builtin_unreachable(), the resulting behavior is undefined. In practice, the compiler may insert arbitrary instructions or data segments after this point, which can lead to unexpected crashes or other strange behaviors.

Thus, when the CACHE instruction was executed, it led to a portion of the CPython interpreter being run that is not directly involved with the .pyc execution. This also explains why the segmentation fault, though consistent across Python versions, manifests differently depending on the Linux distro and Python version, due to variations in the compilation process.
TIP
Suggested Readings and Sources
Tracking the Undefined Behavior Inside Docker
The next step was to run the .pyc file within the provided Docker environment and determine which operations were executed following the CACHE opcode. We attached to the process running inside the Docker and followed it up to the point where the CACHE instruction was executed. This investigation revealed a notable behavior: when the Python interpreter inside the Docker executes a CACHE instruction, the jump performed as part of the usual macro expansion mechanism leads directly to the parsing of the next instruction, executing an assembly code which resembles another macro expansion. Essentially, in the Docker, the execution of the CACHE instruction works similar to a no-operation, allowing the .pyc file’s execution to continue.
This allowed us to continue the dynamic analysis of the .pyc execution from that point on. In particular, the code retrieved the first character from our input and compared it to a Python string object it builds containing only the single character h, matching the initial character of the expected flag format. If this character check failed, the execution path reached a branch that led to a segmentation fault. This fault was triggered by illegal jumps within the executed bytecode. We were now closer than ever.
Solution
To finally solve the challenge, we used libdebug once again. Our script began by attaching to the Python process running inside the Docker environment. We set breakpoints strategically placed just before the call to the PyObject_RichCompare function responsible for comparing one character of our input with the Python string object containing the flag character.
At this execution point, according to the usual SYSTEMV calling convention, rsi held a pointer to the python object related to our input, and rdi contained a pointer to the Python string object containing one flag character. Our first task was to dump the flag character from the Python object at rdi. Specifically, at offset 0x28, the actual string character was located, with other fields holding the reference counter and various Python attributes.
To capture the entire flag in a single execution, we manipulated the pointers to ensure the comparison would pass. By setting rsi equal to rdi, both pointers referred to the same object, thereby guaranteeing the character comparison would succeed. This manipulation allowed the code to proceed seamlessly to the next character comparison.
The script was as follows:
from libdebug import debugger

flag = b""

# This function force the check to be true and dump the flag
def force_and_dump(t, bp):
    global flag
    # Access to the Python object's content
    flag += bytes(t.mem[t.regs.rdi + 0x28])
    # Force the check to be true
    t.regs.rdi = t.regs.rsi
    print(flag)

# Not elegant but it works
pid = input("Enter PID: ")

d = debugger()

d.attach(int(pid))

# Break on the PyObject_RichCompare call
bp = d.bp(0x11f0f9, file="libpython", callback=force_and_dump, hardware=True)

d.cont()

# Wait the end of the execution
d.wait()

d.kill()

print(flag)
Appendix A: Challenge’s Execution Flow
While our solution focused on identifying the point where character-by-character comparisons occur, understanding the complete execution flow of the challenge remains interesting. Here’s a detailed analysis of the bytecode extracted with pycdas.
Asking for the User Input
The first executed instruction is LOAD_LOCALS:
0 LOAD_LOCALS
which:
Pushes a reference to the locals dictionary onto the stack. […]
The locals dictionary may vary based on the execution environment, necessitating analysis within the Docker environment. Here, it appears as follows:
locals_dict = {
    '__name__': '__main__',
    '__doc__': None,
    '__package__': None,
    '__loader__': SourcelessFileLoader('a', '/app/src/a.pyc'),
    '__spec__': None,
    '__annotations__': {},
    '__builtins__': builtins,
    '__file__': '/app/src/a.pyc',
    '__cached__': None
}
NOTE
Python Stack
| locals_dict |
| ... |
The next operation formats literal strings:
2 FORMAT_VALUE 1 (FVC_STR)
The FVC_STR flag indicates a call to str() before formatting the value passed on the stack. Moreover, nofmt_spec are specified. Hence, this intruction takes the locals dictionary, formats it as a string, and pushes it back onto the stack.
NOTE
Python Stack
| str_locals_dict |
| ... |
The subsequent instructions involve constructing an empty tuple and measuring its length:
4       BUILD_TUPLE                     0
6       GET_LEN
These steps result in a 0 (the length) being pushed onto the stack above the empty tuple.
NOTE
Python Stack
| 0 |
| () |
| str_locals_dict |
| ... |
The following operation is a SWAP:
8 SWAP 2
that is defined as:
Swap the top of the stack with the i-th element: STACK[-i], STACK[-1] = STACK[-1], STACK[-i]
The value of i is specified as an argument. In the bytecode, the argument is equal to 2, so it swaps the top of the stack with the second element below it.
NOTE
Python Stack
| () |
| 0 |
| str_locals_dict |
| ... |
Then, the bytecode pops the top item from the stack, removing the empty tuple.
10 POP_TOP
NOTE
Python Stack
| 0 |
| str_locals_dict |
| ... |
Next, the bytecode performs mathematical operations to manipulate the stack’s top value:
12      UNARY_INVERT
14      UNARY_NEGATIVE
After these, ~0 evaluates to -1, and the negative of -1 is 1, leaving 1 at the stack’s top.
NOTE
Python Stack
| 1 |
| str_locals_dict |
| ... |
This pattern of building a tuple, swapping, popping, etc. is repeated:
16      BUILD_TUPLE                     0
18      GET_LEN
20      SWAP                            2
22      POP_TOP
24      UNARY_INVERT
26      UNARY_NEGATIVE
NOTE
Python Stack
| 1 |
| 1 |
| str_locals_dict |
| ... |
28 BINARY_OP 3 (<<)
At this point, the bytecode applies a logical shift using the two last values on top of the stack, which are the previously computed values. Hence, it shifts 1 by 1 making 2. The result is pushed onto the stack.
NOTE
Python Stack
| 2 |
| str_locals_dict |
| ... |
32      BUILD_TUPLE                     0
34      GET_LEN
36      SWAP                            2
38      POP_TOP
40      UNARY_INVERT
42      UNARY_NEGATIVE
44      BINARY_OP                       3 (<<)
48      BUILD_TUPLE                     0
50      GET_LEN
52      SWAP                            2
54      POP_TOP
56      UNARY_INVERT
58      UNARY_NEGATIVE
60      BINARY_OP                       3 (<<)
64      BUILD_TUPLE                     0
66      GET_LEN
68      SWAP                            2
70      POP_TOP
72      UNARY_INVERT
74      UNARY_NEGATIVE
76      BINARY_OP                       0 (+)
80      BUILD_TUPLE                     0
82      GET_LEN
84      SWAP                            2
86      POP_TOP
88      UNARY_INVERT
90      UNARY_NEGATIVE
92      BINARY_OP
The pattern continues, accumulating the results of logical shifts and additions until producing a value of 18.
NOTE
Python Stack
| 18 |
| str_locals_dict |
| ... |
96 BINARY_SUBSCR
This operation is implemented as follows:
key = STACK.pop()
container = STACK.pop()
STACK.append(container[key])
The top of the stack contains 18, while the second-to-last element is the string value obtained from the locals dictionary. Hence, the bytecode accesses the 18th character of the string created from the locals variable. In this case, an i.
Then a store is perfomed on this value.
100 STORE_DEREF 7
The STORE_DEREF instruction is defined as:
Stores STACK.pop() into the cell contained in slot i of the “fast locals” storage.
The bytecode continues with very similar operations, accessing different indexes of the locals dictionary and merging the obtained characters. Simply put, it builds a string using characters from the locals dictionary. After a series of these operations, the code successfully creates the string input.
Subsequently, it executes:
562     LOAD_DEREF                      9
564     LOAD_DEREF                      7
566     BINARY_SUBSCR
570     PUSH_NULL
572     SWAP                            2
574     CALL                            0
Hence, using the string built previously, the bytecode executes a call to the input function, thereby prompting the user for input.
Checking the Flag
Immediately after the call, the result of the input function call is stored in the fast locals storage:
584 STORE_DEREF 10
The bytecode then employs the same technique previously used to extract a character from the locals dictionary. We’ll omit the full bytecode and step-by-step explanation since it is identical to the one already performed.
We jump directly to the end of that segment of code:
782     STORE_DEREF                     7
784     LOAD_DEREF                      7
This stores the obtained character and then loads it again, placing a reference to that value on top of the stack. In this case, the extracted character is an h, which is the first character of the flag format.
Then, the code continues as follows:
786     BUILD_TUPLE                     0
788     GET_LEN
790     SWAP                            2
792     POP_TOP
794     LOAD_DEREF                      10
796     SWAP                            2
798     BINARY_SUBSCR
This sequence is also familiar. It uses the same technique as before to compute a numerical value, then loads the previously stored user input from the fast locals storage, and uses the numerical value as an index. In this first case, as you might expect, it accesses the very first character of the input (index 0).
802     COMPARE_OP                      40 (==)
806     POP_JUMP_IF_TRUE                2 (to 812)
808     JUMP_BACKWARD                   65535 (to -130258)
A comparison operation then compares the two objects on top of the stack, which are string objects containing the first character of the user input and the letter h. If the comparison of these two objects is true—meaning the flag checking for the first character is correct—the code continues to execute a similar logic that checks the second character. Otherwise, a jump backward with a huge immediate value is performed. Since this immediate does not correspond to a valid memory location, the CPython interpreter will segfault. This explains why the segfault also occurs in the Docker environment.
If the entire flag is matched, at the very end, the bytecode employs the same technique to build the string you passed, and then it prints this string using the CALL_INTRINSIC_1 opcode with the argument INTRINSIC_PRINT.
Appendix B: Alternative Solutions
Side-channel
This is actually the initial approach we took for this challenge. The Tower of Hanoi CTF team has a storied history in reverse engineering challenges involving guesswork and the use of side channels. Our initial idea was straightforward: use the dumper we previously explained to track the number of Python instructions executed. We hypothesized that for each correctly input character of the flag, this number would increase.

We tested this method across all our systems, but it didn’t yield the expected results. We suspected that the failure was due the wrong environment where we were executing the side channel, although we did not know the specific reason yet. Consequently, we attempted to implement the same strategy within the Docker environment. However, we encountered obstacles trying to install libdebug there, primarily due to compilation errors with the C bindings it uses internally. Given these issues, we decided to adopt a more systematic approach, as detailed in this write-up.
Since the intersection between those of us writing this write-up and the maintainers of libdebug is not empty, as of this writing, libdebug has been made partially compatible with Alpine (just enough). This enhancement means we can now easily run our side-channel method and get the flag directly within the Docker environment.

NOTE
When redirecting stdin to easily send the flag attempt from the script as the .pyc requests it, the internal execution flow of the call to the Python built-in function input changes compared to when the terminal is used. Generally, this is not a problem since it is managed internally by Python. However, in the specific case of this challenge, the fast locals storage (ab)used during bytecode execution will change according to the input execution flow, causing CPython to crash if the input is not provided by the console as expected. Therefore, we forced the accessed element of the fast locals storage to be the expected one during the side-channel attack. This was accomplished using a callback in libdebug.
from libdebug import debugger
import string

# Define the debugger once
d = debugger(["python", "a.pyc"])

flag = b""

def count_and_fix_locals(t, bp):
    """This callback serves two purposes:

    1. Count the number of times the breakpoint is hit
    2. Fix the fast locals storage to the expected value
    """
    if bp.hit_count == 29:
        # At this point we should fix the fast locals storage
        t.regs.rax = t.regs.r12 - 0x2460

def run_and_get_hit_count(d, ch):
    # Start the process
    r = d.run()

    # Install the breakpoint on a strategic point during the STORE_DEREF opcode execution
    # We both count the number of times the breakpoint is hit and fix the fast locals storage
    bp = d.breakpoint(0x11cca2, file="libpython", hardware=True, callback=count_and_fix_locals)

    # Continue the process
    d.cont()

    # Send the flag attempt to the process
    flag_attempt = flag + ch.encode()
    r.sendline(flag_attempt)

    # Wait for the end of the process
    d.wait()

    # Return the hit count
    return bp.hit_count

# Initialize the hit count using a wrong flag
max_count = run_and_get_hit_count(d, "")

while True:
    found = False
    for ch in string.ascii_letters + string.digits + "{_}":
        hit_count = run_and_get_hit_count(d, ch)

        if hit_count > max_count:
            # We have a new maximum hit count
            # The character is part of the flag
            found = True
            max_count = hit_count
            flag += ch.encode()
            print(flag.decode())
            break

    if not found:
        # We have reached the end of the flag
        break
Custom Python Interpreter
Even though the logic might appear complex, as you may have noticed, the bytecode repeatedly executes the same Python instructions for the entire flag checking process. This suggests how it is feasible to develop a custom interpreter that parses the opcodes and arguments from the .pyc file and simulates its execution.
The key factor to consider here is the necessity to initialize the locals dictionary in exactly the same way as it is in the Docker environment to achieve consistent results. For the implementation of our emulator logic, we relied on the Python documentation. This resource not only describes the meaning of the most common opcodes but often also provides snippets of code that correspond to the high-level operations performed by each instruction.
The final result of our emulator is as follows:
import builtins
from importlib.machinery import SourcelessFileLoader

env_dict = {
    '__name__': '__main__',
    '__doc__': None,
    '__package__': None,
    '__loader__': SourcelessFileLoader('a', '/app/src/a.pyc'),
    '__spec__': None,
    '__annotations__': {},
    '__builtins__': builtins,
    '__file__': '/app/src/a.pyc',
    '__cached__': None
}

OP_MAP = {
    0x57:"LOAD_LOCALS",
    0x9b:"FORMAT_VALUE",
    0x66:"BUILD_TUPLE",
    0x1e:"GET_LEN",
    0x63:"SWAP",
    0x1:"POP_TOP",
    0xf:"UNARY_INVERT",
    0xb:"UNARY_NEGATIVE",
    0x7a:"BINARY_OP",
    0x0:"CACHE",
    0x19:"BINARY_SUBSCR",
    0x8a:"STORE_DEREF",
    0x89:"LOAD_DEREF",
    0x9d:"BUILD_STRING",
    0xc:"UNARY_NOT",
    0x2:"PUSH_NULL",
    0xab:"CALL",
    0x6b:"COMPARE_OP",
    0x73:"POP_JUMP_IF_TRUE",
    0xad: "CALL_INTRINSIC_1",
    0x53:"RETURN_VALUE"
}

class State:
    def __init__(self, code, locals):
        self.stack = []
        self.varnames = [0] *64
        self.varnames[9] = {'input':input}
        self.ip = 0
        self.code = code
        self.locals = locals
        self.flag = ""

    def execute_next_instruction(self):
        ret = 0
        opcode = code[self.ip]
        operand = code[self.ip + 1]

        match OP_MAP[opcode]:

            case "LOAD_LOCALS":
                self.stack.append(self.locals)

            case "FORMAT_VALUE":
                self.stack.append(str(self.stack[-1]))

            case "BUILD_TUPLE":
                count = operand

                if count == 0:
                    value = ()
                else:
                    value = tuple(self.stack[-count:])
                    self.stack = self.stack[:-count]

                self.stack.append(value)

            case "GET_LEN":
                self.stack.append(len(self.stack[-1]))

            case "SWAP":
                i = operand
                self.stack[-i], self.stack[-1] = self.stack[-1], self.stack[-i]

            case "POP_TOP":
                self.stack.pop()

            case "UNARY_INVERT":
                self.stack[-1] = ~self.stack[-1]

            case "UNARY_NEGATIVE":
                self.stack[-1] = -self.stack[-1]

            case "BINARY_OP":
                rhs = self.stack.pop()
                lhs = self.stack.pop()

                match operand:
                    case 0:
                        res = lhs + rhs
                    case 3:
                        res = lhs << rhs

                    case _:
                        print(f"No operation implemented for operand {operand}")
                        ret = -1

                self.stack.append(res)

            case "BINARY_SUBSCR":
                key = self.stack.pop()
                container = self.stack.pop()

                try:
                    self.stack.append(container[key])
                except IndexError:
                    raise RuntimeError("Access out of bounds during BINARY_SUBSCR. Did you enter a long enough input?")

            case "CACHE":
                # Do nothing to simulate the Docker behavior
                pass

            case "STORE_DEREF":
                self.varnames[operand] = self.stack.pop()

            case "LOAD_DEREF":
                self.stack.append(self.varnames[operand])

            case "BUILD_STRING":
                self.stack.append("".join(self.stack[-operand:]))

            case "UNARY_NOT":
                self.stack[-1] = not self.stack[-1]

            case "PUSH_NULL":
                self.stack.append(None)

            case "CALL":
                func = self.stack.pop()
                self.stack[-1] = func()
                #self.stack[-1] = "hkcert24{provola}"

            case "COMPARE_OP":
                # Emulate the correct behavior for the comparison
                self.stack.append(self.stack[-1] == self.stack[-2])

                # Force the comparison to be true and save the flag character
                # self.flag += self.stack[-2]
                # self.stack.append(True)

            case "POP_JUMP_IF_TRUE":
                cond = self.stack.pop()
                if cond:
                    self.ip += 2 * operand

            case "CALL_INTRINSIC_1":
                match operand:
                    case 1:
                        print(self.stack[-1])

                        # Simulate a 0 return value
                        self.stack[-1] = 0

                    case _:
                        print(f"CALL_INTRINSIC_1 with operand {operand} not implemented")

            case "RETURN_VALUE":
                ret = self.stack.pop()

            case _:
                print(f"Opcode {hex(opcode)} not implemented")
                ret = -1

        self.ip += 2
        return ret


    def print(self):
        if self.code[self.ip] in OP_MAP:
            print(f"ip: {self.ip}, next instruction: {OP_MAP[self.code[self.ip]]} {self.code[self.ip + 1]}")
        else:
            print(f"ip: {self.ip}, next instruction: {hex(self.code[self.ip])} {self.code[self.ip + 1]}")

        print("varnames: ", self.varnames)
        print("flag = ", self.flag)
        for i in range(len(self.stack)):
                if "code" in str(self.stack[i]):
                    print("LOCALS")
                else:
                    print(self.stack[i])


# Load the code from the pyc file
with open("./src/a.pyc", "rb") as f:
    code = f.read()

# Remove the header
code = code[0x2a:]

# Initialize the emulator
state = State(code, env_dict)

ret = 0
while ret == 0:
    # Print the current state of the emulation. Comment this line to clean the output
    state.print()

    # Execute the next instruction
    ret = state.execute_next_instruction()

    # Print the flag
    print(state.flag)
Appendix C: CACHE in the time of Python 3.13
It’s important to note that the behavior encountered during the challenge resolution would definitely have been different if the authors had chosen to use Python 3.13. Specifically, when analyzing the CACHE opcode implementation in the Python mainline at the time of writing, notable differences can be observed.
The implementation is as follows:
TARGET(CACHE) {
    frame->instr_ptr = next_instr;
    next_instr += 1;
    INSTRUCTION_STATS(CACHE);
    assert(0 && "Executing a cache.");
    Py_FatalError("Executing a cache.");
    DISPATCH();
}
As shown, the macro Py_UNREACHABLE() has been replaced with Py_FatalError(), which logs the error, and the macro DISPATCH() has been added at the end. This adjustment makes the execution much more reliable and predictable in cases where, unexpectedly, the interpreter executes a CACHE opcode.